Data Cleaning and Preparation in Pandas:
1. Handling Missing Data
Detection of Missing Data
Missing data can cause significant issues in your analysis. Detecting missing data is the first step.
import pandas as pd

# Load data from a CSV file
df = pd.read_csv('/content/Car data1.csv')

# Detect missing values
missing_data = df.isnull().sum()
print(missing_data)
Output:
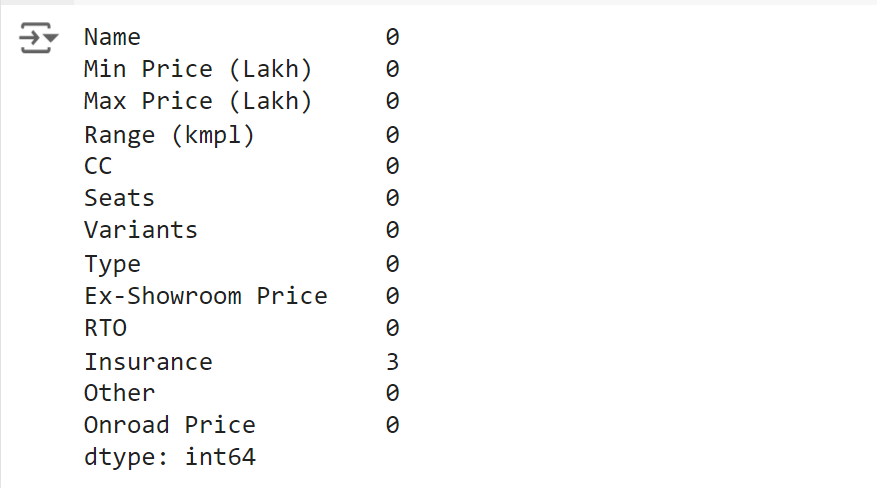
This code loads data from 'Car data1.csv' and detects missing values in each column.
Filling Missing Data
You can fill missing data using various methods, such as using a specific value or forward/backward filling.
# Fill missing values with the mean of the column
df['Insurance'] = df['Insurance'].fillna(df['Insurance'].mean())

# Forward fill missing values
df['Insurance'] = df['Insurance'].ffill()

# Print the DataFrame to see the result
print(df)
Output:
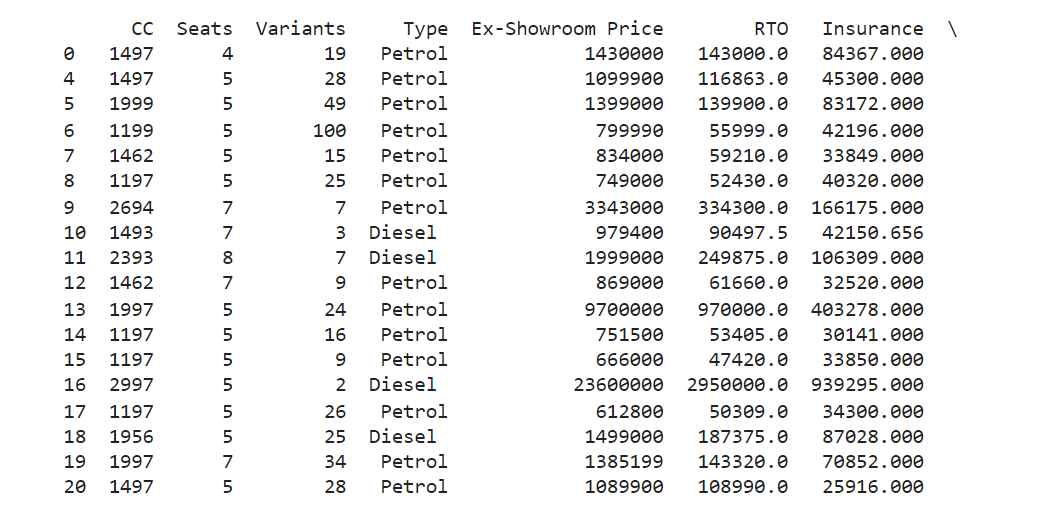
The first method fills missing values with the mean, while the second method uses the last valid observation to fill missing values.
Dropping Missing Data
If a column or row has too many missing values, you might want to drop it.
# Drop rows with any missing values
df = df.dropna()

# Drop columns with any missing values
df = df.dropna(axis=1)
print(df)
Output:
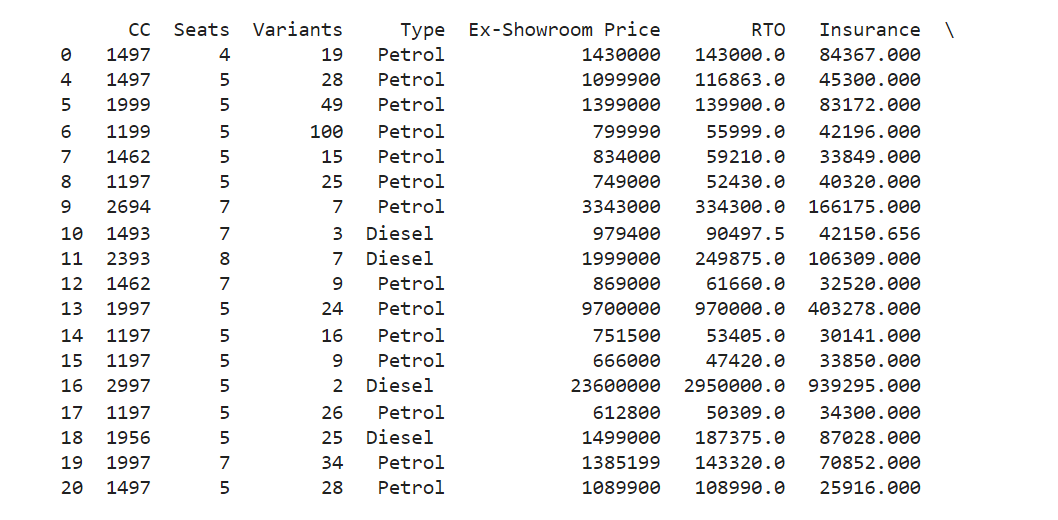 This code drops rows or columns containing any missing values.
2. Removing Duplicates
Duplicates can skew your analysis, so it is important to remove them.
# Remove duplicate rows
df = df.drop_duplicates()

# Remove duplicate rows based on a specific column
df = df.drop_duplicates(subset=['Other'])
print(df)
Output:
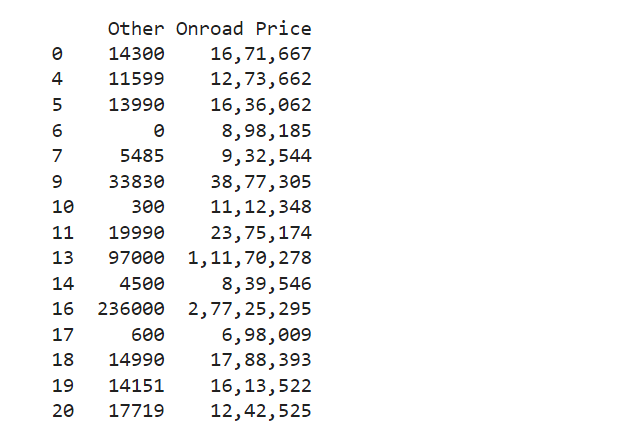
The code removes all duplicate rows or duplicates based on a specific column.
3. Data Transformation
Data transformation involves modifying your data to suit the analysis.Renaming Columns
Renaming columns can make your data more readable and consistent./p>
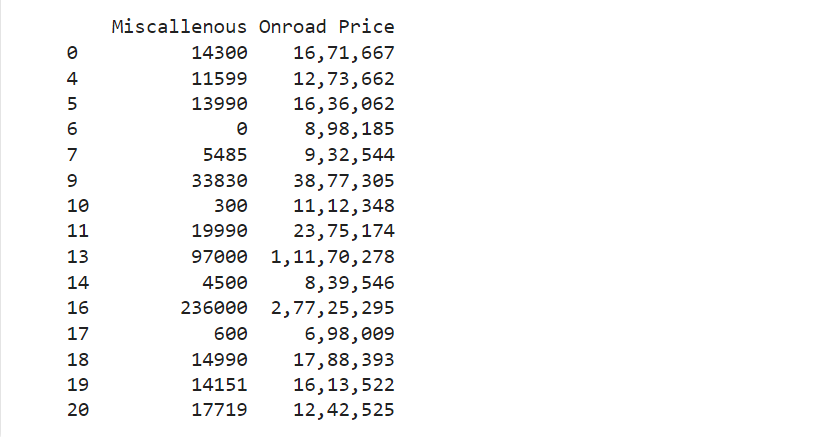
  # Rename columns
  df = df.rename(columns={'Other': 'Miscallenous'})
  print(df)
Output:
Mapping Values
Mapping values is useful for converting categorical data or simplifying data.
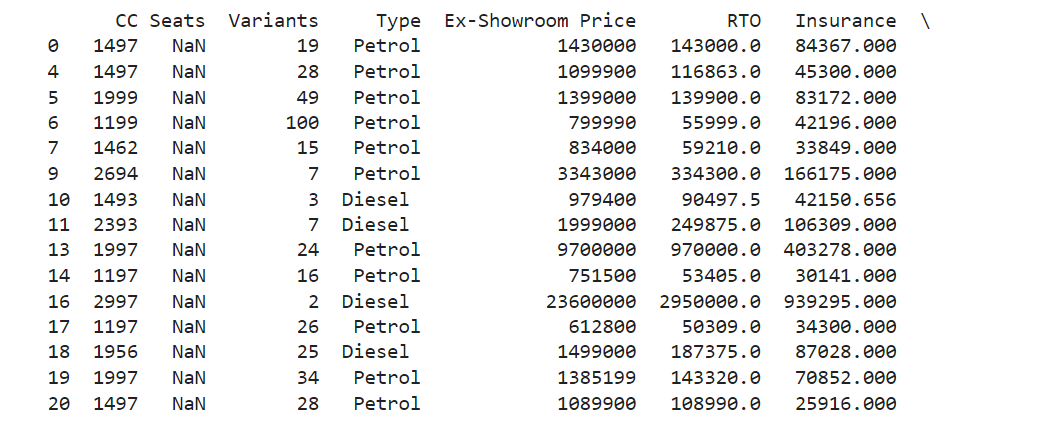
# Mapping values in a column
df['Seats'] = df['Seats'].map({'7': '5'})
print(df)
Output:
Changing Data Types
Sometimes, data types need to be changed to fit the analysis.
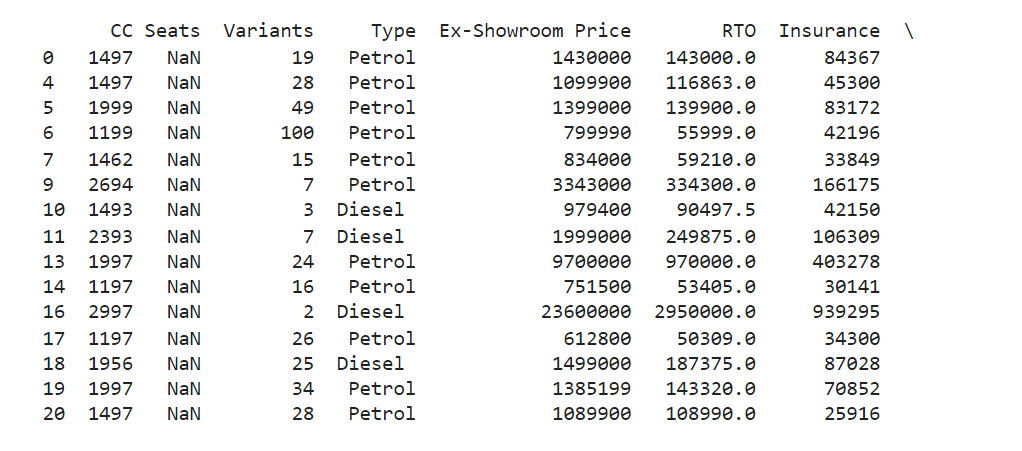
# Convert column to integer type
df['Insurance'] = df['Insurance'].astype(int)
print(df)
Output:
4. Handling Outliers
Outliers can distort your data analysis. Identifying and handling them is crucial.Detecting Outliers
You can detect outliers using statistical methods like the IQR (Interquartile Range) method.
# Detect outliers using IQR
Q1 = df['CC'].quantile(0.25)
Q3 = df['CC'].quantile(0.75)
IQR = Q3 - Q1

# Filtering out outliers
outliers = df[(df['CC'] < (Q1 - 1.5 * IQR)) | (df['CC'] > (Q3 + 1.5 * IQR))]
print(outliers)
Output:
